Mastering Dashboard UI for Enhanced Business Insights
Dashboard UI is a powerful tool that transforms raw data into actionable insights, making it an essential component for professionals and businesses. A well-designed dashboard can significantly improve decision-making, streamline processes, and enhance overall productivity. This article explores how Dashboard UI, combined with statistic graphs, data charts, and diagrams, can revolutionize the way you manage and present information.
Understanding the Power of Dashboard UI
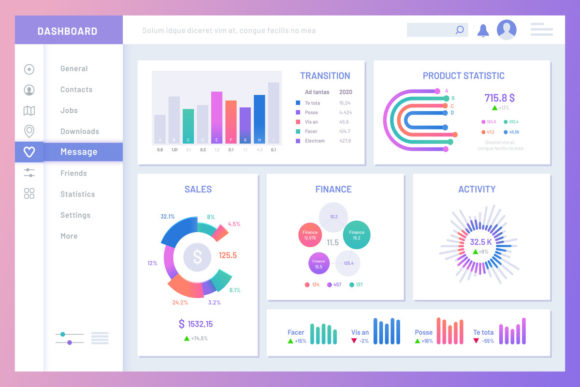
A Dashboard UI is a user interface that provides a visual representation of key metrics and data points. It consolidates complex data into a single, easy-to-understand view, allowing users to quickly grasp the most important information at a glance. This is particularly useful in fast-paced environments where timely decisions are critical.
Enhancing Decision-Making with Visual Data
One of the primary benefits of using a Dashboard UI is its ability to enhance decision-making. By presenting data in a clear and visually appealing manner, dashboards help users identify trends, patterns, and anomalies more easily. For instance, a marketing manager can use a dashboard to monitor campaign performance, quickly spotting which ads are performing well and which need adjustments.
Streamlining Communication and Collaboration
Dashboards also play a crucial role in improving communication and collaboration within teams. When everyone has access to the same real-time data, it becomes easier to align on goals and strategies. For example, a project management team can use a dashboard to track progress, deadlines, and resource allocation, ensuring that all members are on the same page and can make informed decisions together.
Practical Benefits of Dashboard UI
Beyond just presenting data, Dashboard UI offers several practical benefits that can support various business functions:
- Time Efficiency: Dashboards save time by eliminating the need to sift through multiple reports and data sources. With all relevant information in one place, users can focus on analysis and action rather than data collection.
- Improved Presentation: A well-designed dashboard not only presents data clearly but also makes it visually appealing. This is especially important when presenting to stakeholders or clients, as a professional and polished presentation can leave a lasting impression.
- Support for Creativity: Dashboards can be customized to fit specific needs, allowing users to get creative with their data visualization. This flexibility can lead to innovative ways of presenting and understanding information, fostering a more dynamic and engaging environment.
Who Can Benefit from Dashboard UI?
The versatility of Dashboard UI means that it can be beneficial for a wide range of professionals and industries:
- Marketers: Marketers can use dashboards to track campaign performance, customer engagement, and ROI. This helps in optimizing marketing strategies and achieving better results.
- Project Managers: Project managers can benefit from dashboards by monitoring project timelines, budgets, and resource utilization. This ensures that projects stay on track and any issues are identified and resolved promptly.
- Financial Analysts: Financial analysts can leverage dashboards to analyze financial data, track budget variances, and forecast future trends. This supports more accurate and timely financial reporting and decision-making.
Limitations and Considerations
While Dashboard UI offers numerous benefits, it's important to consider some limitations and situations where other tools might be more appropriate:
- Data Accuracy: The effectiveness of a dashboard depends on the accuracy and quality of the data it presents. Ensuring that the data is up-to-date and reliable is crucial for making informed decisions.
- User Customization: While dashboards can be highly customizable, this requires some level of technical skill. Users who are not familiar with data visualization tools may find it challenging to create and maintain their own dashboards.
- Integration with Existing Systems: For seamless data flow, dashboards should be integrated with existing systems and data sources. Compatibility and integration capabilities are important considerations when choosing a dashboard solution.
Conclusion: Embrace the Power of Dashboard UI
In summary, Dashboard UI is a versatile and powerful tool that can significantly enhance the way you manage and present data. Whether you're a marketer, project manager, financial analyst, or any other professional, the benefits of using a well-designed dashboard are clear. By providing a clear, visual, and accessible way to view and analyze data, Dashboard UI can help you make better decisions, save time, and achieve your goals more effectively.
For those looking to start using Dashboard UI, consider the Statistic Graphs, Data Charts, and Diagrams Infographic Template. This template includes a JPEG 72ppi and an EPS10 file, allowing you to separate elements, remove, or edit as needed using a vector editor like Adobe Illustrator. This flexibility ensures that you can tailor the dashboard to meet your specific needs and preferences, making it a valuable addition to your toolkit.